The following is based on this this example on how to do emotion analysis over an entire show (all episodes), posted in my limbic python package.
Data and Processing Setup
All subtitles for every episode of Game of Thrones (from season 1 to 7) were downloaded from subscene manually. IMDB information was obtained using the OMDB API using limbic’s IMDB integration. This data is freely available with the limbic package.
As mentioned in limbic’s documentation, you need to set up a specific mapping when dealing with domain-specific terms that have a specific meaning. For example, in Game of Thrones, the term lord is widely used across all episodes and has a connotation
close to my lord rather than the lord. In NRC lexicons, the term lord does have a strong joy value as it’s probably closely associated with the latter definition. As I don’t want to overestimate the emotion joy across the episodes, a new meaning for the word my lord can b done by associating it to the word sir.
In the show, there are also composed terms (e.g. your grace or white walkers) that are partially included in the NRC lexicons as well as terms that are not included at all (e.g. kingslayer). Unfortunately, these words have particular meanings in the show, which will be associated with more precise terms when building the limbic lexicon-based emotion classifier as shown below.
A more detailed and rich context mapping could be built by analyzing how and where some frequent words are used, but it’s outside the scope of this analysis. This could be an interesting research project and extension for limbic if you are interested.
Emotions Analysis
The limbic package provides some tools that can make it easier to analyze subtitles. In particular, computing a set of emotions features, correlating it with IMDB ratings, and analyzing a moving window of emotions during the episodes are some examples of what could be interesting to see from this data.
Regarding the features available in limbic, let’s define \(E\) as the set of emotions in the lexicon used, \(T_e\) the set of times (in seconds) of an episode where emotion \(e \in E\) is present, of size \(N_{T_e}\), and \(v_e(t)\) the value associated to the emotion at time \(t\). Then, for each episode of a season, the features computed are the following:
First, the total_e is defined as the total emotion \(e\) across the whole episode,
\[\text{total_e} = \sum_{t\in T_e} v_e(t), \forall e\in E\]The average emotion,
\[\text{avg_e} = \frac{1}{N_{T_e}} \sum_{t\in T_e} v_e(t), \forall e \in E\]Max variation of total emotion for moving windows of time across the episode. Let \(w_{e}(t)\) be the total emotion between \(t\) and \(t+w\), that is \(w_{e}(t) = \sum_{i=t}^{t+w} v_e(i)\), then max_delta_e is defined as max value from the set of windows \(\omega_e(t) = \{w_{e}(t) - w_{e}(t-s)\}\), for \(t \in \{s, s+1, \dots, N_{T_e}-w\}\), \(\forall e\in E\) where \(s\) (default value 120 seconds) is the step of the moving window \(w\) (default 300 seconds).
The time at which the max variation of total emotion is present, defined as
\[\text{time_max_delta_e} = \arg\max_{t} \omega_{e}(t), \forall e\in E\]The direction of the emotion \(e\in E\), defined as
\[\text{dir_e} = \sum_{t\in T_e} v_e(t) - \sum_{t\in T_{e'}} v_{e'}(t)\]where \(e'\) is the opposite emotion of \(e\) according to the Plutchik wheel of emotions.
Correlation and Regression Analysis
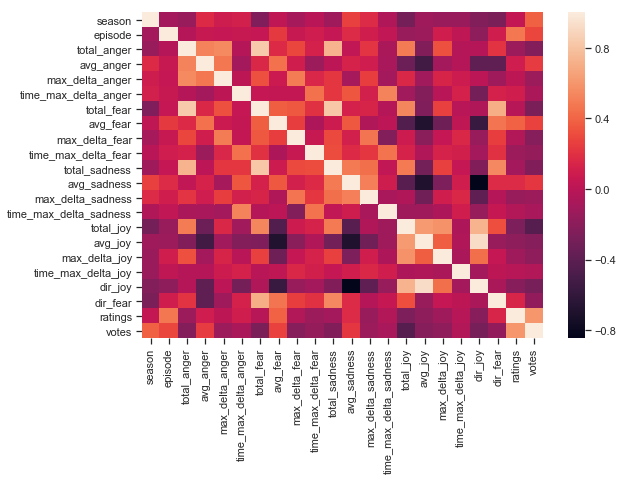
Looking at the correlation matrix, the variable ratings seem to have a weak positive correlation with some fear related variables (avg_fear, \(\rho \approx 0.39\)) and a weak negative correlation with some joy related variables (total_joy, \(\rho \approx -0.262\)). This is more or less expected given the type of series that Game of Thrones is, and what people expects of a dark fantasy story. Note that joy is not the opposite of fear, that would be sadness and anger respectively. In this case, both sadness and anger related emotions were not particularly correlated to the user ratings.
It’s also interesting to see how the episode number is highly correlated to the user ratings (\(\rho \approx 0.478\)), which means that early episodes are not rated the same that final episodes within a season, for all seasons. This could make sense if you think that most of the significant plot twists and outcomes are at the end of each season, where people are far more involved and expectant than at the beginning of a season. I’m sure several other shows have this same behavior when final episodes are well written and satisfying for the fans.
Let’s take a more in-depth look into some of the fear and joy variables.
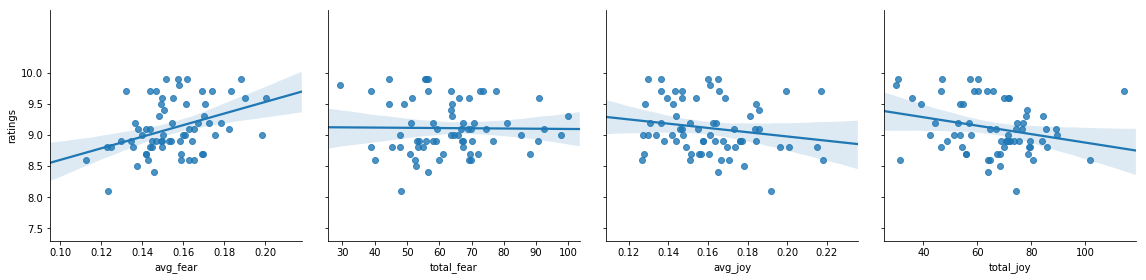
First and foremost, given the number of data points (67 episodes), these are not results that someone could claim as statistically significant. However, these might be enough data points to reveal some trends that are worth discussing.
These plots don’t provide new hard evidence (from what we could get out of the correlation analysis), but it’s interesting to see the trends in scatter plots. From this, it’s easy to see how total_fear doesn’t explain the ratings as strongly as avg_fear, but both total_joy and avg_joy do have a similar trend, with a higher correlation for total_joy.
Regression analysis results using variables total_e, \(\forall e\in E\), are presented in the ascii-table below. Even though all regression coefficients are small and the regression intercept is quite substantial, total_fear has a positive impact over ratings (positive coefficient, \(p\)-value \(< 0.05\)), and joy has a negative impact (negative coefficient, \(p\)-value \(< 0.05\)). As the null hypothesis in such analysis is that there’s no relationship between total_e, \(\forall e\in E\) variables and ratings, at least
for joy and fear we can reject it and conclude that the alternative hypothesis holds.
=================================================================================
                    coef    std err          t      P>|t|      [0.025      0.975]
---------------------------------------------------------------------------------
Intercept         9.4616      0.248     38.182      0.000       8.966       9.957
total_fear        0.0175      0.008      2.229      0.029       0.002       0.033
total_joy        -0.0084      0.004     -2.316      0.024      -0.016      -0.001
total_sadness    -0.0069      0.008     -0.894      0.375      -0.022       0.009
total_anger      -0.0136      0.009     -1.533      0.130      -0.031       0.004
==============================================================================
This confirms that ratings for Game of Thrones have, at some degree, a positive relationship with fear and a negative relationship with joy, but there’s no special relationship with sadness or anger. Let’s visualize side by side the words that inspire fear versus the words that inspire joy.
Word Clouds
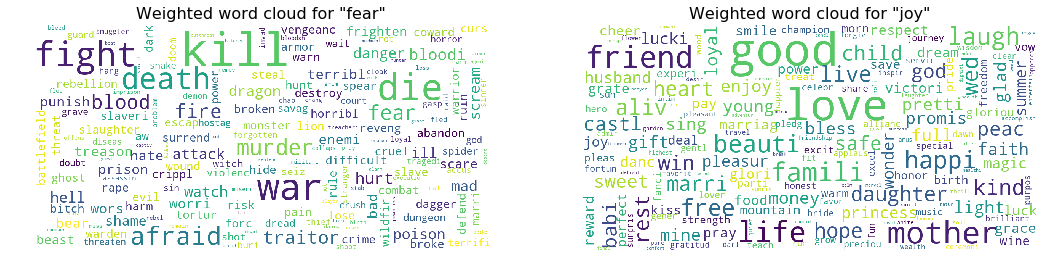
Based on this, audiences do prefer dialogs with more terms like war, fight or afraid rather than friend, love, or mother. Maybe GRRM Martin said it best in his book A Dance with Dragons:
"Words are wind, even words like love and peace.
I put more trust in deeds."
With this quote, he explains perfectly the observed effect. Words like love and peace (clearly joy-inducing words) are proven to be empty, not lasting or at risk (at least in the show), while words like war or fight are actions that will undoubtedly have some real effect and often painful consequences to the characters. In summary, you could say that audiences will give higher ratings to episodes where there are more action and less empty words.
However, there’s an important factor I need to isolate before finishing this discussion. Why sadness and anger do not explain the ratings when words like death are indeed present in those emotions as well?
Let’s review side by side all terms for anger, sadness, fear, and joy keeping the ones that are unique per emotion.
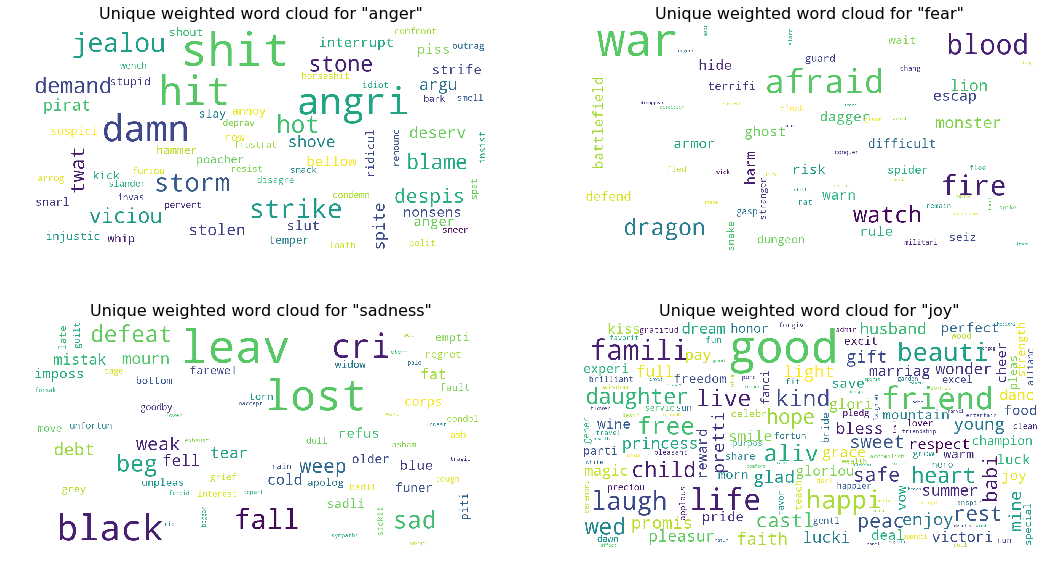
Words in anger plot seem to be mostly related to “short term” actions (e.g. hit), swearing (e.g. damn), and specific feelings (e.g. jealousy). Words in the sadness plot seem to be associated with the aftermath of significant events (lost, sad). However, it can be argued that the words included exclusively in the fear category, are the ones associated with the events that will actually cause sadness or anger.
Emotions over time
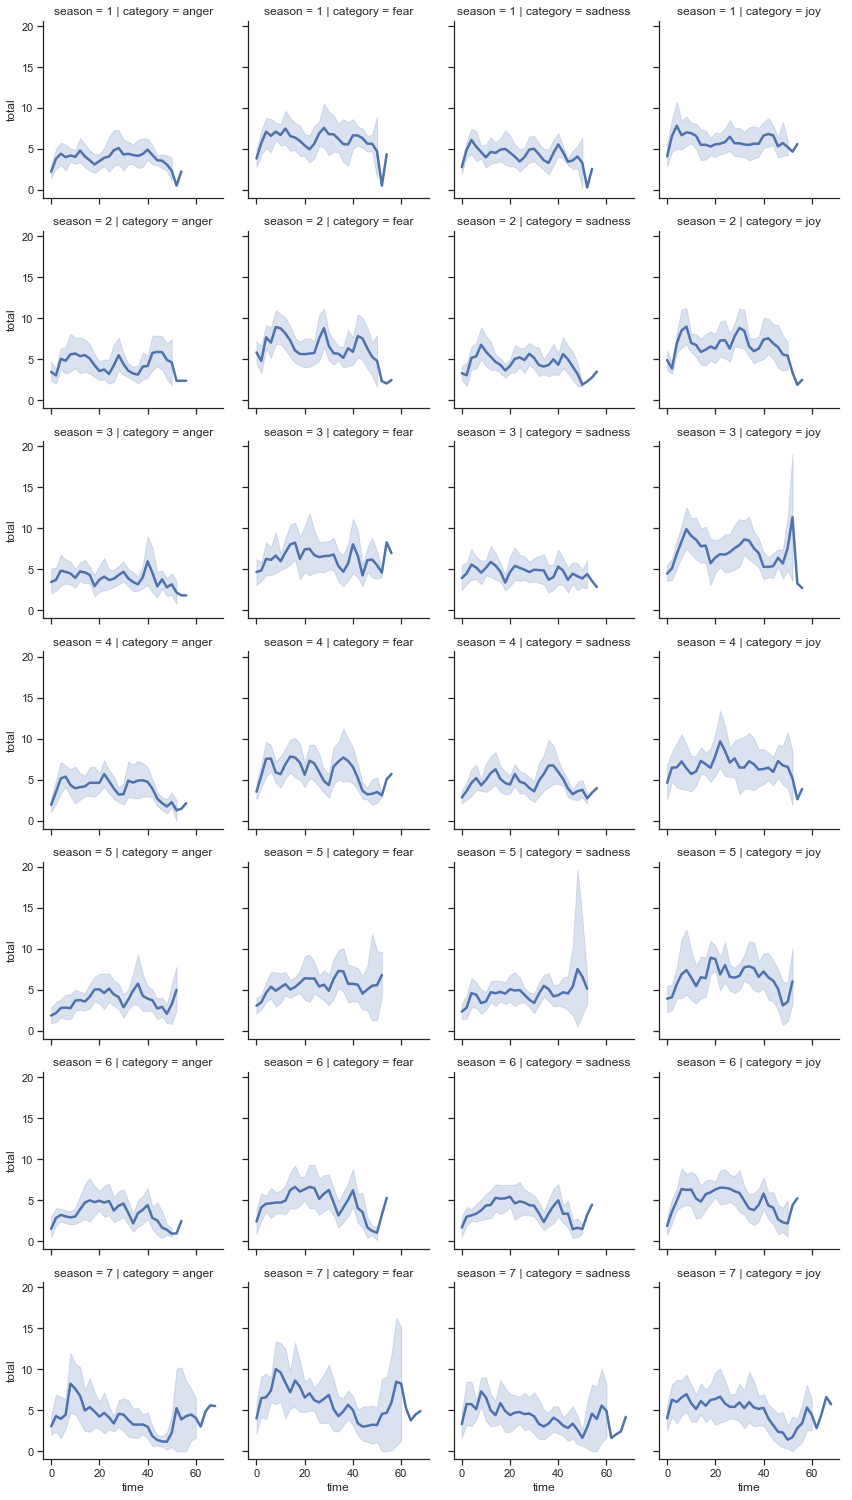
Above you can see how each emotion is distributed per season. For example, you can see how joy, sadness, and fear have some spikes in season 3, season 5, and season 7 respectively.
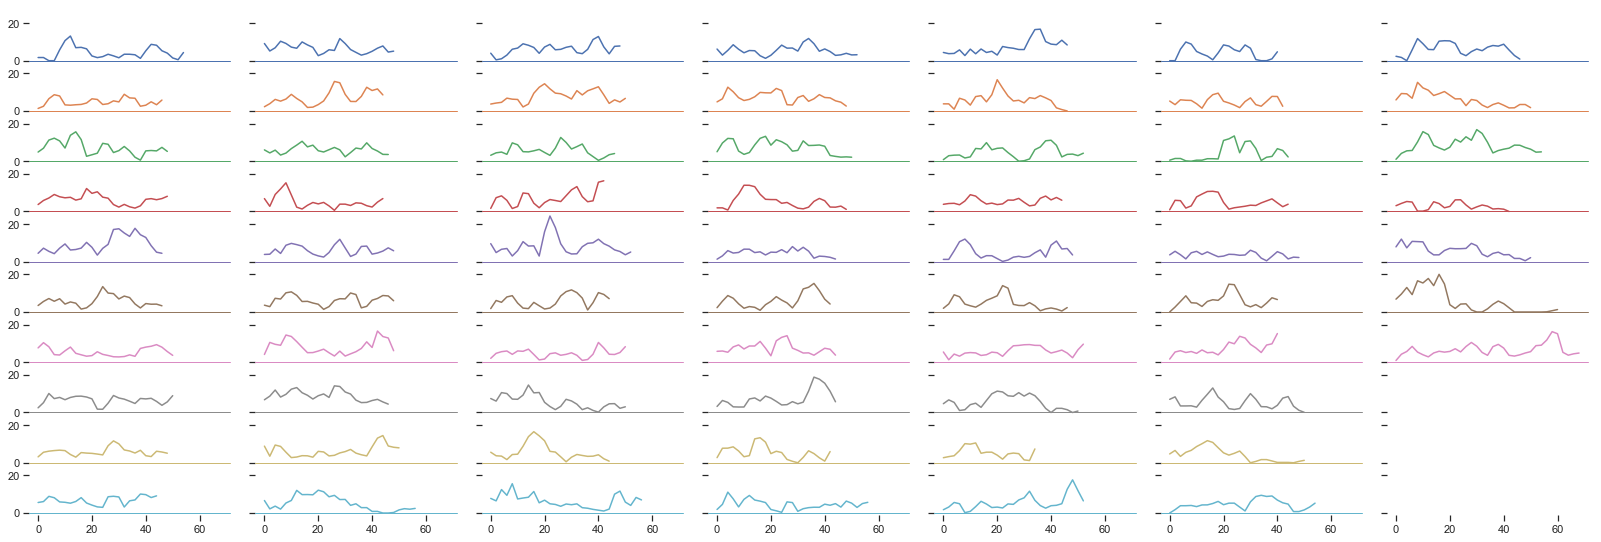
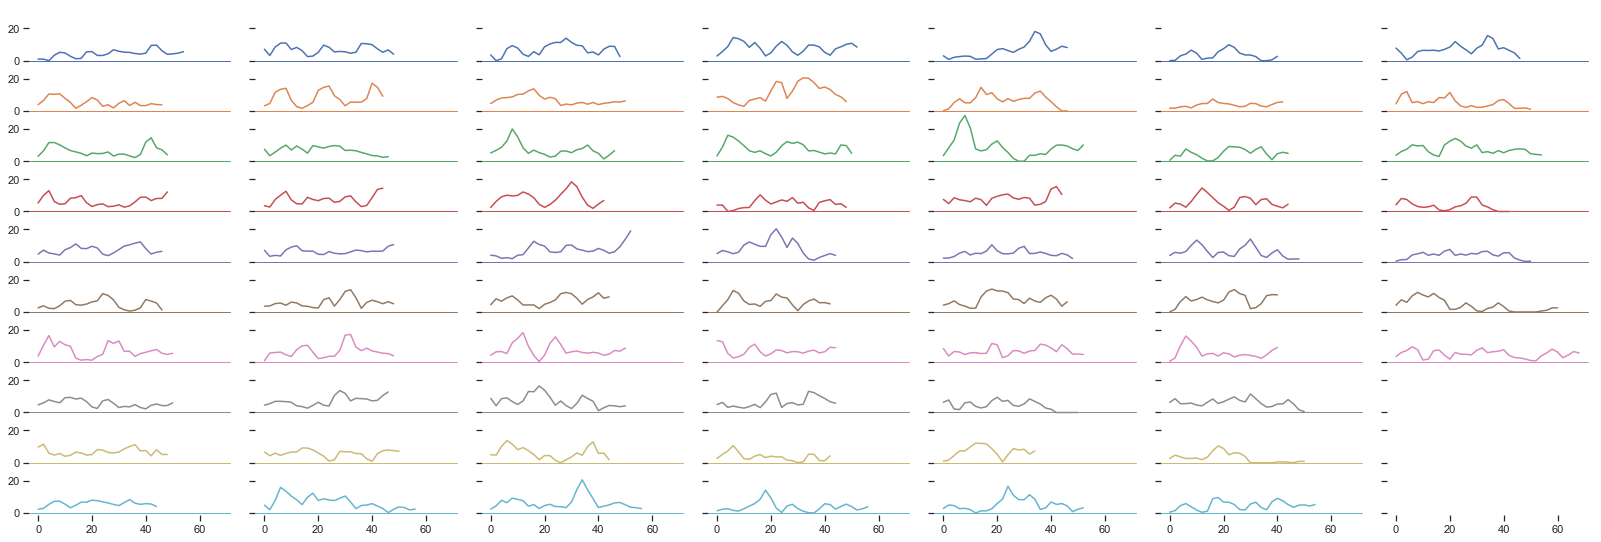
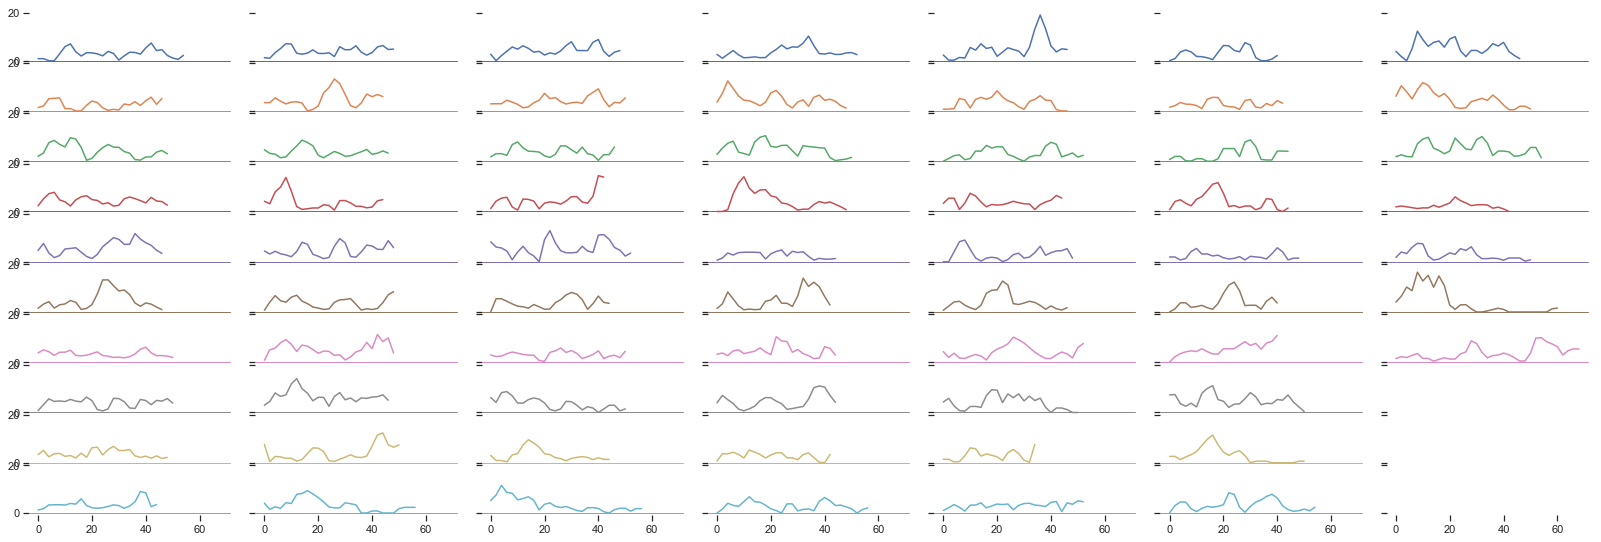
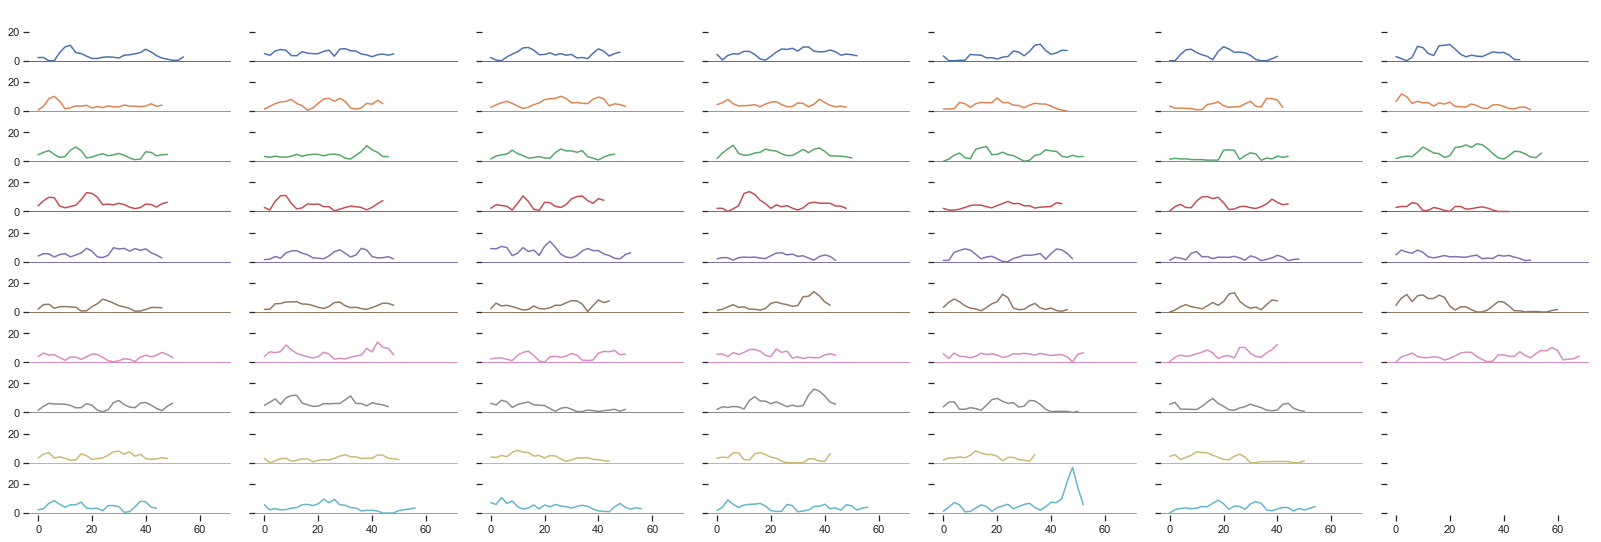
I invite you to correlate these patterns together with the ones presented below, which is the same but all emotions are fleshed out for each episode of each season. Here, each column represents a season and each row an episode.
This guide (thanks to jjadjjadj for this madness!) can help you go through certain episodes and see how emotions variations represent some of the main events in the show.
For example, you can see above a spike in sadness in season 5. Below, in the sadness chart, you can see in row 10 and column 5 a high peak a little before the end of the episode. If you follow the insane guide above, this episode corresponds to S5E10 "Mother's Mercy" (column 50), which is when Cercei’s walk of atonement happened, and the word shame was said quite a lot (shame has sadness score 0.594).
Also, you can see how low values are similar among all emotions, which might be associated to scenes in the episodes where none or little dialog is present, though it’s fascinating how this is most common across entire seasons. This could be explained by the fact that live-action scenes with battles, fights, dragons, and the like, are usually displayed approximately at the same time, often a little before the end of each episode.
Future Work
Some of the missing elements that I’d love to add some time in the future to this analysis are the following:
- Silence analysis. Given that not only emotions from words could be significant in a show where battles, action, or even music, do have a substantial reception by audiences, it’s interesting to see whether the lack of vocalized emotions have (or not) an impact on the ratings (e.g. episodes where battles are predominant vs. episodes where there’s a lot of talking).
- Expand the context dictionary with other terms that could represent better the specific emotions in the series to get more precise results (e.g. add more subtle terms like “bend the knee” or “Azor Ahai”).
- Compare these results with other results from similar and completely different shows to contrast by “how much” does fear and joy have an impact on ratings, and if such effect is somehow constant in drama shows or not.
- Include season 8 subtitles into the analysis.
If you have any other interesting questions and future work, please let me know in the comments section. Your feedback can help to add more features and analysis tools to the limbic python package.
In case you find any error (misinterpretation of results, typos, etc.) or any misleading or slightly debatable results, please let me know as well. I’ll try to fix the issues as soon as possible.