This analysis covers all papers downloaded from NeurIPS conferences between 2009 and 2019 using the [NeurIPS crawler]. Originally I wanted to process and analyze all papers from 1987 to this date as I have all the data, but I decided to focus just in the last ten years of data.
This post’s primary goal was to explore D3.js more extensively using some well-known data from a different angle. I know there are probably dozens of blog posts and Kaggle scripts that do a comprehensive analysis of NeurIPs data, but I haven’t seen an analysis for co-authorship on main topics from an Institution’s perspective.
This post’s secondary goal was to put much of the processing code into a new python package that I called papeles. The word papeles is a literal translation for papers into Spanish. Most of this code is not exceptionally interesting, but it was worth cleaning and refactoring into a lightweight package for others (or my future self) to use. This package is very experimental, so I did not include unit tests and it can be significantly improved. If you want to improve something, you are more than welcome to send pull requests or create issues. I’ll be checking on those regularly.
How institutions interact with each other in machine learning research?
To answer this question, I pulled all the papers raw content using the papeles package and extracted the first page (or so) for each paper, focusing exclusively on the first section just before the abstract. From this section, I was able to identify which institutions are mentioned with some tooling I added to papeles. Then, using all institutions extracted per paper, it was easy to create a graph representation of the co-authors (at the institutions level) for each paper: Each institution is a node, and for each time I found two institutions as co-authors, I created an edge (or increased the weight) between each node.
When visualizing graphs, most examples I’ve seen are using the graph’s force-directed representation (e.g., this one). I tried this and got a very messy view that wouldn’t provide any visualization insight. Looking at interconnected institutions in a hierarchical edge bundling graph offers a sweet spot between observing which institutions are highly connected and who, in a summarized way, can be enriched with extra signals by hovering the mouse over each institution.
In this plot, red line means that the origin node has a lower degree than the destination node, and blue line means that it has a higher degree. Also, note that I’m not using all nodes, this is just a subset filtering the original graph by all nodes with at least 20 papers in NeurIPS.
The general properties of the graph are the following:
Number of nodes: 63
Number of edges: 723
Average degree:  22.9524
Are there institutions that mostly publish with a specific group?
For this, I’m using the well known Louvain method for community detection in graphs. For more details about this method, please check [Blonder et al. (2008)].
When applying this method to the graph, there are at least 8 clusters that have enough information to be interesting (more details in the script). Checking for example the first cluster (as presented below), it’s interesting to see that it reflects a mainly european institutions, with some exceptions. More in-depth analysis can be done to understand why these exceptions are clustered together with european institutions and not with other similar or regional institutions (e.g. Kyoto University, City University of Hong Kong, University of Sidney, Université de Montreal, and École Polytechnique de Montreal). Note that Twitter and Google have strong precense in the U.K. so it’s not surprising to see a strong co-authorship dependency with other U.K. institutions, however, it’s very interesting to see Uber in this particular cluster.
['university of oxford',
 'deepmind',
 'universite de montreal',
 'university of cambridge',
 'google brain',
 'university of edinburgh',
 'university of british columbia',
 'university of california los angeles',
 'alan turing institute',
 'max planck institute for intelligent systems',
 'city university of hong kong',
 'university of texas at arlington',
 'university college london',
 'technical university of munich',
 'university of bristol',
 'uber',
 'university of virginia',
 'technical university of denmark',
 'imperial college london',
 'university of sydney',
 'technische universitat berlin',
 'university of southampton',
 'university of freiburg',
 'ecole polytechnique de montreal',
 'twitter',
 'ghent university',
 'university of warwick']
To visualize the results, I decided to use a TreeMap based on the results published in [Mylavanparu et al. (2019)], which at the same time allows us to inspect visually other properties of the network, in particular centrality measures. These measures provide insights into how institutions are connected to other nodes in the graph.
In the TreeMap, you can see painted with different colors that correspond to the top communities (ranked by number of nodes) identified in the co-authoring institution’s network. Most of the centrality measures show very similar behavior.
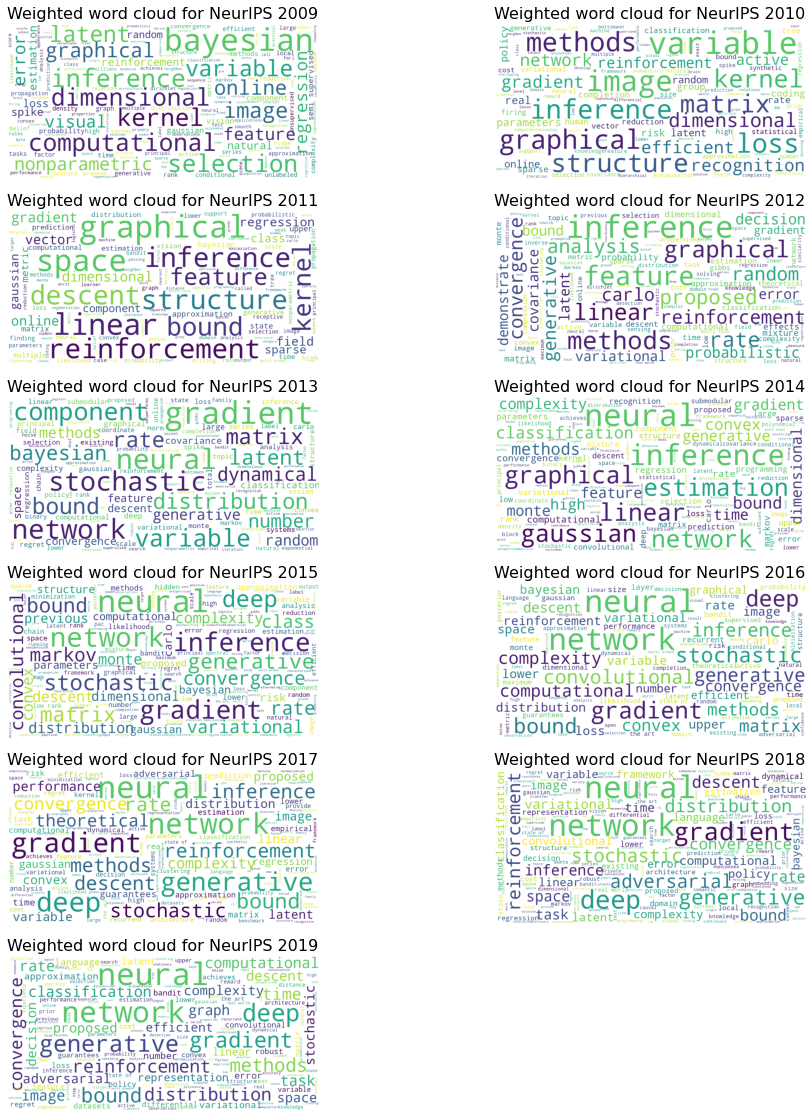
What are the current trends of ML research?
The answer to this question is very well known. Anyone with some degree of understanding about ML should be able to answer this with Deep Learning. However, while Deep Learning research captures all the mainstream attention, there are other exciting areas to keep an eye on. For example, Adversarial Machine Learning is an area of research that has gotten some traction over the last few years. It has been fueled by Deep Learning and Generative Adversarial Networks (aka GANs), but ~10 years ago this was a very fringe and pretty much inexistent research area.
Also, I find it very interesting what is going on with topics that were very hot +10 years ago and today are almost abandoned. “Classical” machine learning models like Kernel methods or Graphical models are rarely mentioned these days, far less mentioned than more popular research topics lie Neural Networks and Deep Learning.
Listing all the possible research topics in machine learning could be a daunting task, so I used a fairly simple non supervised NLP model to extract this automatically from the research papers with the goal of generating the top 100 topics in ML. For this, I created first a list of keywords from the abstracts from all papers. Then, while just keeping the keywords that are present more than N times across topics in a particular year, I used a non-supervised topic modeling tool called Latent Dirichlet Allocation (particularly the one available in the gensim package). All this code is available in the papeles package, and examples on how to use it is available in this script.
How has been the collaboration between institutions over time?
In the following, you can see how institutions have been increasingly collaborating as NeurIPS got more popular. This is most likely the effect of having a larger volume of papers in recent years (higher volume of papers means a probability of institution collaborating).
Please check the script in papeles for details on how the topics were computed and how the names were assigned.
Several follow-up questions can be done by using this dataset, analysis tool, and visualization strategies, but I’ll leave that for another time. Questions like “which are the institutions that have co-authoring papers the most together over time” or “which are the institutions with more influence on topics like ConvNets” could be done quickly using papeles and the set of scripts available.
Interestingly, the answer to the first question is University of Washington and Microsoft Research.
2009 - 1st Topic (Probabilistic Graphical Models)
2009 - 2nd Topic (Bayesian Methods)
2009 - 1st Topic (Probabilistic Graphical Models)
2009 - 2nd Topic (Bayesian Methods)
2010 - 1st Topic (Probabilistic Graphical Models)
2010 - 2nd Topic (Reinforcement learning)
2010 - 1st Topic (Probabilistic Graphical Models)
2010 - 2nd Topic (Reinforcement learning)
2011 - 1st Topic (Probabilistic Graphical Models - Inference)
2011 - 2nd Topic (Neural networks)
2011 - 1st Topic (Probabilistic Graphical Models - Inference)
2011 - 2nd Topic (Neural networks)
2012 - 1st Topic (Bayesian Inference)
2012 - 2nd Topic (Probabilistic Graphical Models)
2012 - 1st Topic (Bayesian Inference)
2012 - 2nd Topic (Probabilistic Graphical Models)
2013 - 1st Topic (Markov Decision Processes)
2013 - 2nd Topic (Matrix decomposition)
2013 - 1st Topic (Markov Decision Processes)
2013 - 2nd Topic (Matrix decomposition)
2014 - 1st Topic (Probabilistic Graphical Models)
2014 - 2nd Topic (Neural Networks)
2014 - 1st Topic (Probabilistic Graphical Models)
2014 - 2nd Topic (Neural Networks)
2015 - 1st Topic (Deep Learning Optimization)
2015 - 2nd Topic (Deep Learning Models)
2015 - 1st Topic (Deep Learning Optimization)
2015 - 2nd Topic (Deep Learning Models)
2016 - 1st Topic (Deep Learning Optimization)
2016 - 2nd Topic (Deep Learning Models)
2016 - 1st Topic (Deep Learning Optimization)
2016 - 2nd Topic (Deep Learning Models)
2017 - 1st Topic (Deep Learning Optimization)
2017 - 2nd Topic (Deep Learning Models)
2017 - 1st Topic (Deep Learning Optimization)
2017 - 2nd Topic (Deep Learning Models)
2018 - 1st Topic (Deep Learning Optimization)
2018 - 2nd Topic (Deep Learning Models)
2018 - 1st Topic (Deep Learning Optimization)
2018 - 2nd Topic (Deep Learning Models)
2019 - 1st Topic (Deep Learning Optimization)
2019 - 2nd Topic (Deep Learning Models)
2019 - 1st Topic (Deep Learning Optimization)
2019 - 2nd Topic (Deep Learning Models)